Activation Function
Activation function is a function that is added into an artificial neural network in order to help the network learn complex patterns in the data.
When comparing with a neuron-based model that is in our brains, the activation function is at the end deciding what is to be fired to the next neuron
Sigmoid function
A sigmoid function is a mathematical function having a characteristic "S"-shaped curve or sigmoid curve.
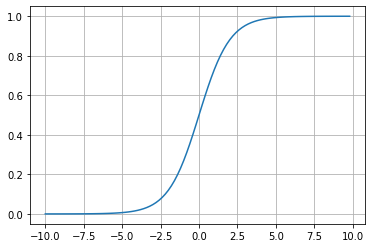
- \( \sigma(x) = \frac{1}{1 + e^{-x}}\)
import math
import matplotlib.pyplot as plt
import numpy as np

def sigmoid(x):
    a = []
    for item in x:
        a.append(1/(1 + math.exp(-item)))
    return a

x = np.arange(-10., 10., 0.2)
sig = sigmoid(x)

# plot sig
plt.plot(x,sig)
plt.show()
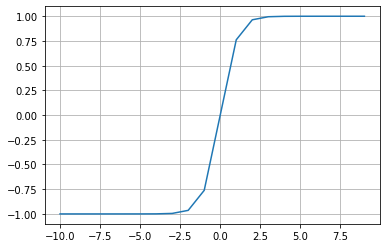
Hyperbolic tangent activation function
It is also referred the \(Tanh\) (also “tanh” and “TanH“) function. It is very similar to the sigmoid activation function and even has the same S-shape. The function takes any real value as input and outputs values in the range -1 to 1.
# plot for the tanh activation function
from math import exp
import matplotlib.pyplot as plt

# tanh activation function
def tanh(x):
	return (exp(x) - exp(-x)) / (exp(x) + exp(-x))

# define input data
inputs = [x for x in range(-10, 10)]
# calculate outputs
outputs = [tanh(x) for x in inputs]

# plot inputs vs outputs
plt.plot(inputs, outputs)
plt.grid()
plt.show()
Refer: How to Choose an Activation Function for Deep Learnin
Softmax
from numpy import exp

# softmax activation function
def softmax(x):
	return exp(x) / exp(x).sum()

# define input data
inputs = [1.0, 3.0, 2.0]
# calculate outputs
outputs = softmax(inputs)
# report the probabilities
print(outputs)
# report the sum of the probabilities
print(outputs.sum())
[0.09003057 0.66524096 0.24472847]
1.0
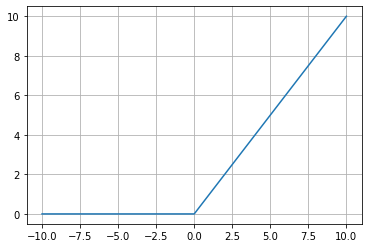
Rectified Linear Activation Function
A node or unit that implements this activation function is referred to as a rectified linear activation unit, or ReLU for short.
# demonstrate the rectified linear function

# rectified linear function
def rectified(x):
	return max(0.0, x)

# demonstrate with a positive input
x = 1.0
print('rectified(%.1f) is %.1f' % (x, rectified(x)))
x = 1000.0
print('rectified(%.1f) is %.1f' % (x, rectified(x)))
# demonstrate with a zero input
x = 0.0
print('rectified(%.1f) is %.1f' % (x, rectified(x)))
# demonstrate with a negative input
x = -1.0
print('rectified(%.1f) is %.1f' % (x, rectified(x)))
x = -1000.0
print('rectified(%.1f) is %.1f' % (x, rectified(x)))
Plotting
# plot inputs and outputs
from matplotlib import pyplot

# rectified linear function
def rectified(x):
	return max(0.0, x)

# define a series of inputs
series_in = [x for x in range(-10, 11)]
# calculate outputs for our inputs
series_out = [rectified(x) for x in series_in]
# line plot of raw inputs to rectified outputs
pyplot.plot(series_in, series_out)
pyplot.show()